Introduction
As part of the Udacity - Data Science Nano Degree program I recently completed a task where I had to use a given data set, analyse it and come up with heuristics based recommendations. This blog post will present the final conclusions and recommendations I came up with after the analysis.

A Note on the Dataset
The Starbucks Udacity Data Scientist Nano-degree Capstone challenge data set simulate how different promotional offers impact user interaction and decisions on Starbucks mobile rewards app. There are three types of offers as per the data set: buy-one-get-one (BOGO), discount, and informational - all of which are delivered over multiple channels. The main task is to identify different segments of users based on their identifiable feature (like age, income, transaction patterns etc) to offer better targeted promotional offers. Also finding other patterns and trends like the impact of each offers on the different segments of users etc.
The basic task is to use the data to identify which groups of people are most responsive to each type of offer, and how best to present each type of offer.
The data spread across three different files. See related more info below:
Data Dictionary
- profile.json - Rewards program users (17000 users x 5 fields)
    - gender: (categorical) M, F, O, or null
    - age: (numeric) missing value encoded as 118
    - id: (string/hash)
    - became_member_on: (date) format YYYYMMDD
    - income: (numeric)

- portfolio.json - Offers sent during 30-day test period (10 offers x 6 fields)
    - reward: (numeric) money awarded for the amount spent
    - channels: (list) web, email, mobile, social
    - difficulty: (numeric) money required to be spent to receive reward
    - duration: (numeric) time for offer to be open, in days
    - offer_type: (string) bogo, discount, informational
    - id: (string/hash)

- transcript.json - Event log (306648 events x 4 fields)
    - person: (string/hash)
    - event: (string) offer received, offer viewed, transaction, offer completed
    - value: (dictionary) different values depending on event type
    - offer id: (string/hash) not associated with any "transaction"
    - amount: (numeric) money spent in "transaction"
    - reward: (numeric) money gained from "offer completed"
    - time: (numeric) hours after start of test
Motivation
The problem that I chose to solve was to build a set of heuristics to help decide what offers works best for certain age and gender demographics. I chose a simple approach where the users who converted (completed offer) were analysed based on gender, age, and income bracket.
At the end I intended to create two user list, one of top user's user id list and the second user id list of potential customers based on transaction behavior, which can be used in re-marketing different products. And given the marketing cost these lists are helpful to target other products to true fans (First list) and use more offers to capture more revenue from the potential users (second list).
Analysis
The analysis process involved following the CRISP-DM methodology. After the cleaning of the data set exploratory data analysis was done on three data set files. Transcript file was a combination of Transaction event, offer received, offer viewed, offer completed data. I needed to separate this into 4 different data frames before proceeding for the sake of simplicity.
Merging offer received, viewed and completed data in the proper format helped us figure the impact of each offer. And recommend the top three offers. We also found 2 offers which were not resulting in any conversion.
# Consolidating/mergin offer received, viewed and completed data.

a = pd.merge(offer_received_data, offer_viewed_data, on=['offer_id', 'person'], how='left')
b = pd.merge(a, offer_completed_data, on=['offer_id', 'person'], how='left')
b = b[['offer_id','person','event_x', 'event_y', 'event', 'time_x', 'time_y', 'time']]
b = b.rename(columns={
    'event_x': 'offer_received',
    'event_y':  'offer_viewed',
    'event': 'offer_completed',
    'time_x':'time_received',
    'time_y':'time_viewed',
    'time': 'time_completed'})

cols = ['offer_received', 'offer_viewed', 'offer_completed']
for col in cols:
    b[col] = b[col].apply(lambda x: 0 if x is np.nan else 1)

# There can be cases where the user might not have viewed the offer but still completes it.
# To avoid this we are going to remove all such conversions from user summary.
b = b[b['offer_viewed'] == 1]

cols = ['time_received', 'time_viewed', 'time_completed']
for col in cols:
    b[col] = pd.Series.fillna(b[col], np.infty)

offers_user_summary = copy.deepcopy(b)
offers_user_summary.groupby(['offer_id']).mean().sort_values(by='offer_completed', ascending=False)
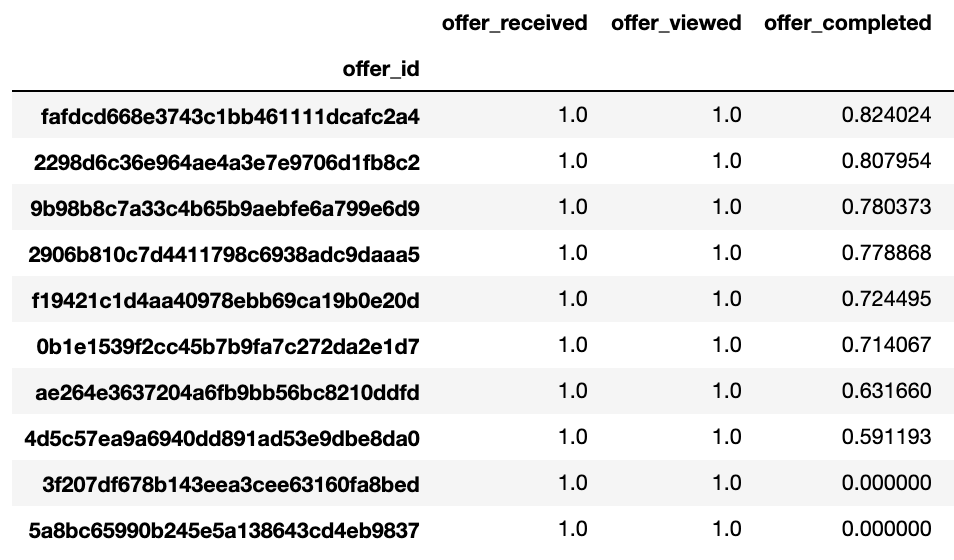
After finding the top offers I tried to figure out what makes these offers different from the rest. First, I tried to see age wise distributions of all offers.
# Lets find out what makes our top offer (fafdcd668e3743c1bb461111dcafc2a4) different from others.
# Lets look at age wise distribution of transactions.

t = c[c['offer_completed']==1].groupby(['age_bracket', 'offer_id']).count()['person']
t.unstack(level=0).plot(kind='barh', figsize=(10,8), title='Offerwise age freqency graph')

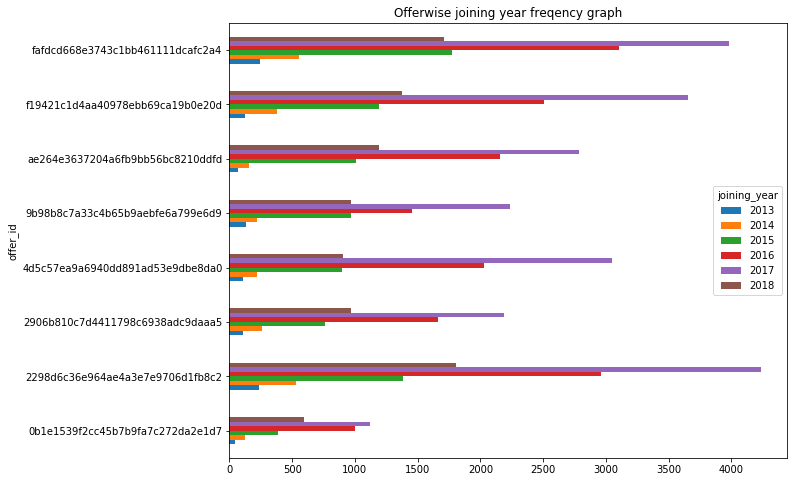
Second, I tried to figure out if the users interaction and preference has anything to do with how long they have been using the app.
# Lets look at joining year wise distribution of transactions.

t = c[c['offer_completed']==1].groupby(['joining_year', 'offer_id']).count()['person']
t.unstack(level=0).plot(kind='barh', figsize=(10,8), title='Offerwise joining year freqency graph')
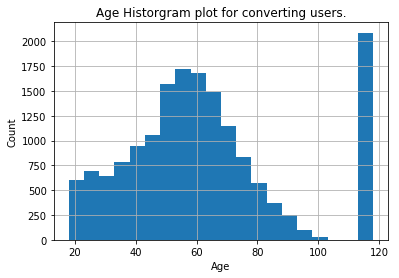
The transaction event data separated from transcript file gave us age, gender, and income wise transaction events and revenue data. This was helpful to come up with the user lists to find the true fans and potential users for re-marketing. Based on this I also tried to probe age and income wise trends. See how the bar graph below peaks at age close to 60.
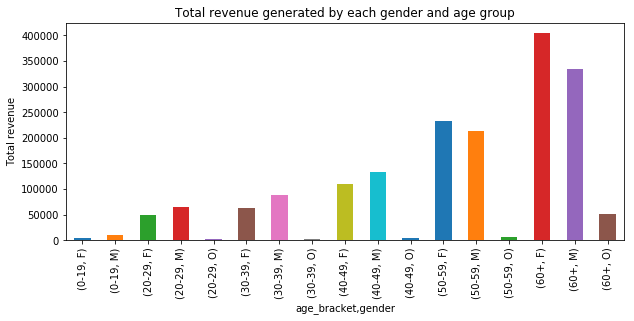
I then tried to find the revenue trends based different age brackets. See how the bar graph below peaks at age close to 50-59 and 60+ age groups.
# Plotting bar graph for - Total revenue generated by each gender and age group

plt.figure(figsize=(10,4))
plt.title('Total revenue generated by each gender and age group')
plt.xlabel('Age_bracket & gender')
plt.ylabel('Total revenue')
g = age_split_user_summary.groupby(['age_bracket', 'gender']).sum().copy()
g['revenue'].plot(kind='bar')
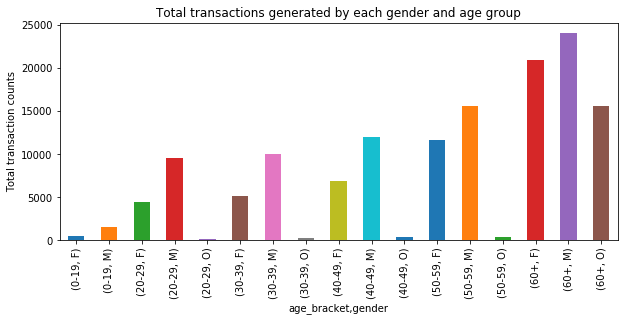
# Plotting bar graph for - Total transactions generated by each gender and age group

plt.figure(figsize=(10,4))
plt.title('Total transactions generated by each gender and age group')
plt.xlabel('Age_bracket & gender')
plt.ylabel('Total transaction counts')
g = age_split_user_summary.groupby(['age_bracket', 'gender']).sum().copy()
g['counts'].plot(kind='bar')
Based on all the analysis I mentioned above different trends, learnings and observations were noted. Let's dive into these now.
Observations
Based on my analysis I observed that
- Average user transactions count is 8.38
- Average user age 62 years
- Average user income 57000.
Top three two age brackets and gender groups that result in highest number of transactions and in turn revenue are:
- 60+ Male, 60+ Female
- 50-59 Male, 50-59 Female
- 40-49 Male, 40-49 Female
- There is not much difference in income gap between the users who transact based on their age, and gender groups.

- 3 out of 5 top offers
    - were discount offers. And they had high difficulty but low reward.
    - were sent on all 4 channels.
- 2 out of 5 top offers were bogo offers with medium difficulty and medium reward.
- Highest offer completion rate (conversion rate) is for the offer: fafdcd668e3743c1bb461111dcafc2a4 (~82%).
- We should send this offer more.
- We also observed that the top 2 offers are performing really well for 50+ age demographics.
- And the top offer performs better than the second best because of slightly better conversion rate in the 50-59 category.
- Maximum offers were completed by the users who joined in 2017 and followed by 2016.
- Users who joined in 2018 were completing lesser number of offers compared to those who joined in 2016 and 2017.
Metric for selecting top offer
For selecting the top offers the metrics I chose - the highest completion rate (conversion rate) which is nothing but the percentage of users who completed the offer after viewing them. Reason behind this was simple - as intuitively, we know that the more the conversions the more the revenue increases.
Based on above metrics: Top Three offers were -
- fafdcd668e3743c1bb461111dcafc2a4
- 2298d6c36e964ae4a3e7e9706d1fb8c2
- 9b98b8c7a33c4b65b9aebfe6a799e6d9
The below mentioned offers didn't result in any conversion. We should stop sending these particular offers.
1. 3f207df678b143eea3cee63160fa8bed
2. 5a8bc65990b245e5a138643cd4eb9837
Recommendations
Send the top three offers more, especially for
- users who joined in 2016-2017
- users in the age group 50+
Send offers in all 4 channels for better conversions.
Test and optimise the below mentioned two categories (based on offer type) for better conversions
- different discount offers with high difficulty and low reward.
- different bogo offers with medium difficulty and medium rewards
stop sending below mentioned offers.
1. 3f207df678b143eea3cee63160fa8bed
2. 5a8bc65990b245e5a138643cd4eb9837
Conclusion
I set out to to analyse Starbucks Udacity Data Scientist Nano-degree Capstone challenge data set, which is a simulation of customer behavior on the Starbucks rewards mobile application. The problem that I chose to solve was to build a set of heuristics to help decide what offers works best for certain age and gender demographics and also come up with any recommendations based on different trends and learnings from the dataset.
I was able to find the top three offers based on the metric I chose (which was highest offer conversion rate). I also found couple of offers which didn't result in any conversions. Based on the heuristics recommendations were made to send more of the top performing offers and stop sending the offers which didn't perform well. Other offer wise recommendations were also made.
I have also created top converting user list (total Ids 3941). This list was based on the user who were in the 75th percentile of the conversion counts of all the users.
- These users are like 1000 true fans.
- They enjoy the product & we need not send offers to them.
I have also created least converting user list (total Ids 4037). This list was based on the users who were in the 25% percentile of the conversion counts of all the users.
- These users have converted but has potential to convert more.
- These user ids can be used for re-marketing by offering better offers so that they convert more.
Next steps
Next step is to build a simple machine learning model to predict the users who has high chance of conversion (completing the offers) based on offer viewed and completed data.
The complete analysis as Jupyter notebook is available in my github repository -