Introduction
As part of the Udacity - Data Science Nano Degree program I recently completed a task where I had to use a given data set, analyse it and ask between 3-5 questions related to the business or real-world context of the data. And then each question must be answered with appropriate visualization, table, or statistic. This blog post will present the final conclusions I came up with after the analysis.
A note on the Data Set
The Data set I chose for this task was Seattle Airbnb Open Data which is an open data set provided by Airbnb. Since 2008, guests and hosts have used Airbnb to travel in a more unique, personalized way. As part of the Airbnb Inside initiative, this dataset describes the listing activity of homestays in Seattle, WA.
 Photo by Kelsey Dody on Unsplash
Content
The following Airbnb activity is included in this Seattle dataset:
- Listings: including full descriptions and average review score
- Reviews: including unique id for each reviewer and detailed comments
- Calendar: including listing id and the price and availability for that day
Questions I was interested in
The immediate questions that come to a traveller using any homestay service are cost and quality of stay that he is going to get. And what better way to understand the quality of stays than the review of thousands of users who used the service itself. And we were in luck as the data set provided information on both fronts. The calendar data provided all the pricing and availability info of the different Airbnb properties across the year. Whereas the Listings data provided comprehensive information about the listed property from address, specialities of the property, services offered, ratings etc. So the questions I come up with were:
1. Are there any general trends in pricing across the year?
This question is relevant for both the business and for the fellow travellers who use the service. For a business, this shows a trend that they can study more closely and optimise based on seasonality. For fellow travellers, this gives them a good sense of the time of the year when they can get affordable homestays and plan accordingly.
This was pretty straight forward. To answer this I used the calendar data and grouped the data according to date and calculated the mean of the listed property prices. And later plotted on a graph to see the trend.
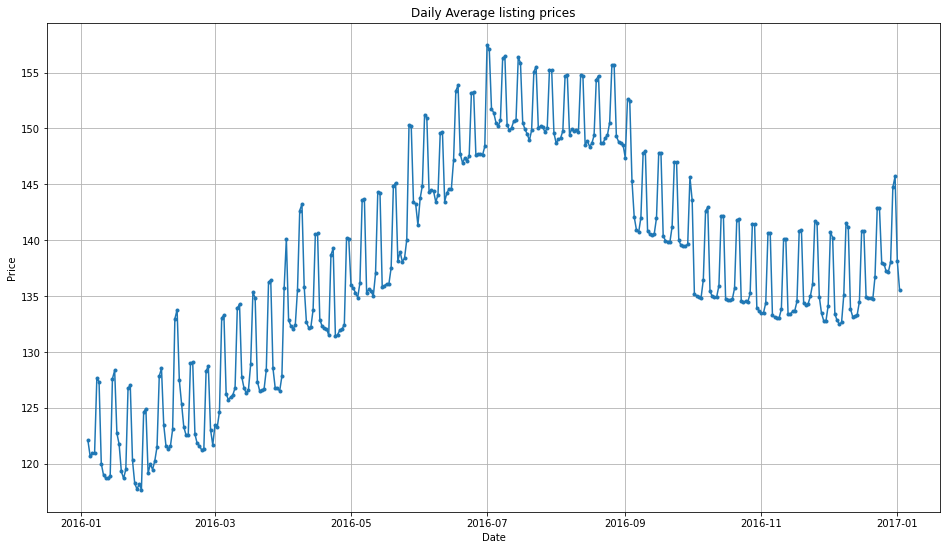
Some observations from the graph:
1. lowest prices in January until March.
2. Peak prices in July until August
3. Prices increase from January till August and then decreases to an average price by December.
Based on these observations we can see that the prices did have a steady trend. The prices are the lowest in January till March and slowly increases until July - August which is peak pricing. Then it drops to average pricing by December. So we can safely say the most affordable time of year to book Seattle Airbnb is during January - March. And the costliest time of the year when the prices are the highest is during July - August.
2. Which part of Seattle neighbourhood has the highest review score rating using listing descriptions?
The listings data provides a well-cleaned column of neighbourhood details which is extracted and cleaned to give a set of neighbourhood values. Also, the listings data has data about the average review scores on different factors like a score for cleanliness, check-in score, a score for location, aggregate score etc. For the purpose of this question, I chose the aggregate score of all the users for an individually listed property.
I grouped the data according to the neighbourhood and calculated the mean review scores of the listed property. And took the top 5 neighbourhood names from the sorted scores list. Which again was pretty straightforward given the really cool pandas functions.
### Analysing the neighbourhood wise data

# Finding the top neighbourhood based on review scores.
top_neighbourhood = listings.groupby('neighbourhood_group_cleansed')['review_scores_rating'] \
                    .mean().reset_index().set_index('neighbourhood_group_cleansed') \
                    .sort_values('review_scores_rating', ascending=False)
top_neighbourhood = top_neighbourhood.head(5)
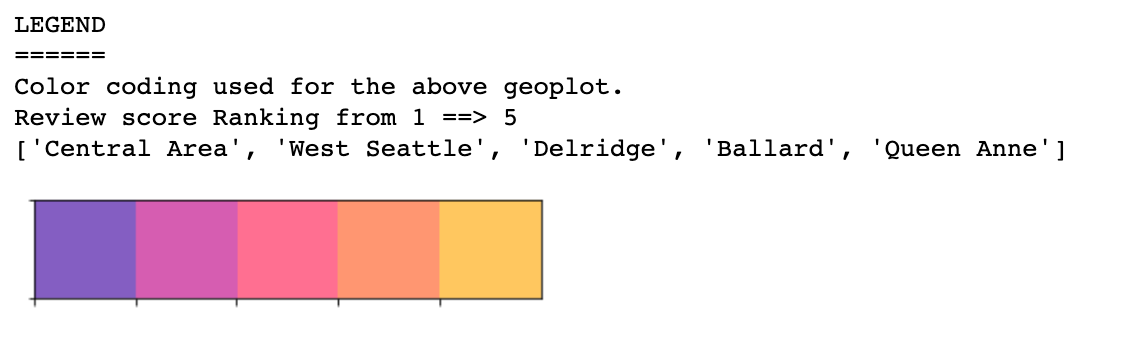
Top 5 neighbourhood in Seattle based on review scores were:
1. Central Area
2. West Seattle
3. Delridge
4. Ballard
5. Queen Anne
As travellers will be most probably seeing properties on a map before making decisions based on different factors like amenities nearby and places to visit etc. I thought of plotting the areas in a graph and respective properties in a map. An amazing library called “Geopandas” came for the rescue. I used the Seattle City Open Data to get the shapefile used for creating the maps used for this task. You can see the plotted map below.
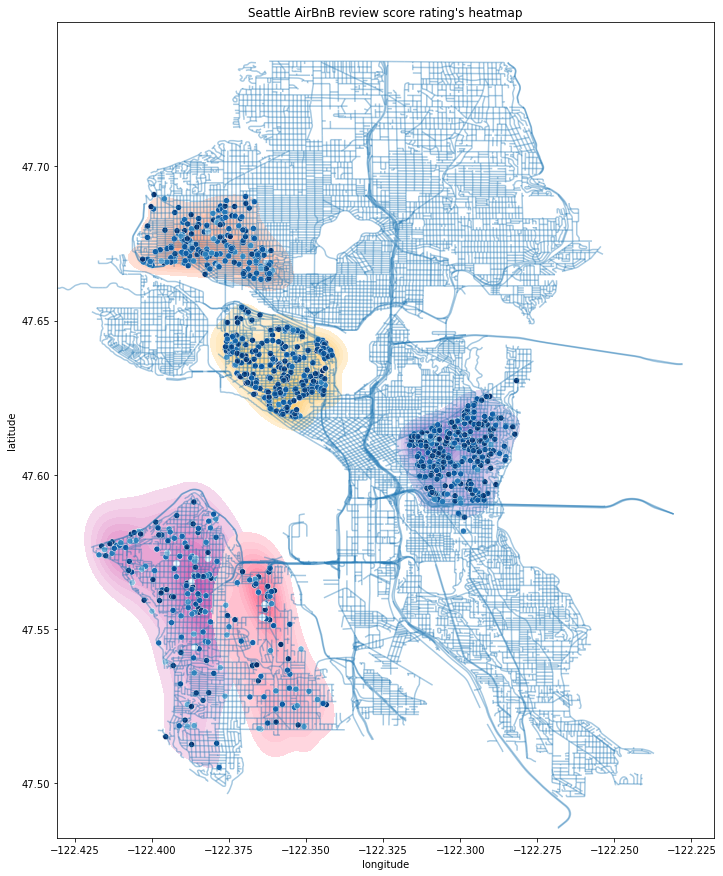
We can see that southern western Seattle which included neighbourhoods like West Seattle and Delridge is highly rated by customers.
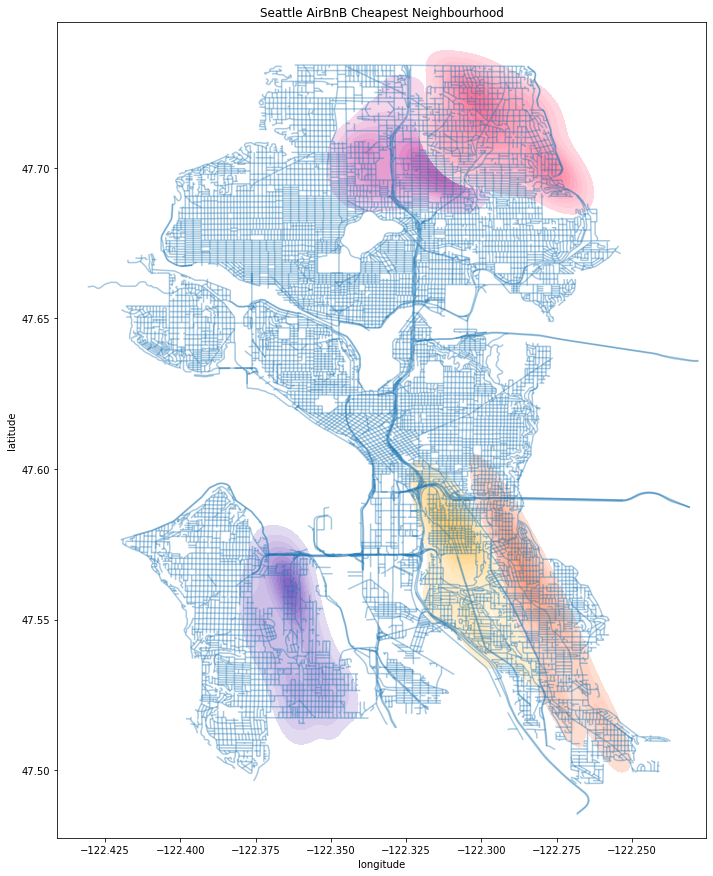
3. Which are the top 5 costliest and cheapest Seattle neighbourhood?
This was a little tricky as we had to use both pricing details from the calendar data set and neighbourhood details from listings data set. I merged this data based on listing ids and the grouped based on neighbourhood names and took the mean of the prices. After sorting and taking the top 5 will give us the cheapest and bottom half will give us the names of costliest neighbourhoods in Seattle. Based on the analysis:
-
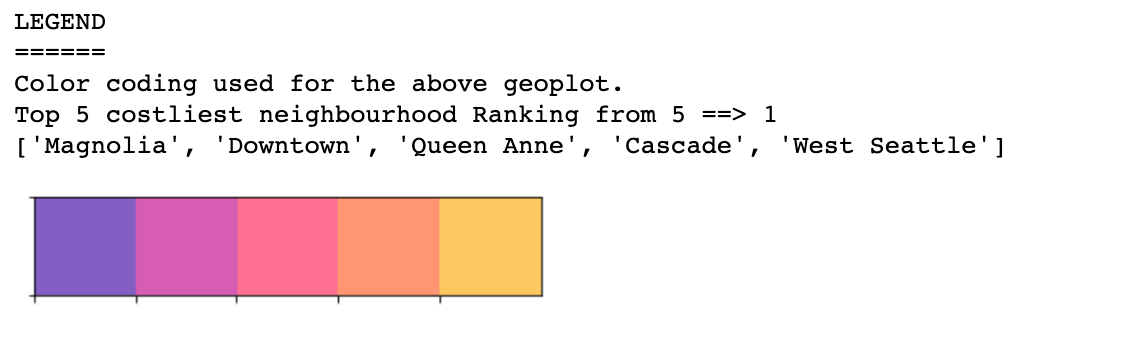
Top 5 Costliest Neighbourhood in Seattle
1. Magnolia 2. Downtown 3. Queen Anne 4. Cascade 5. West Seattle -
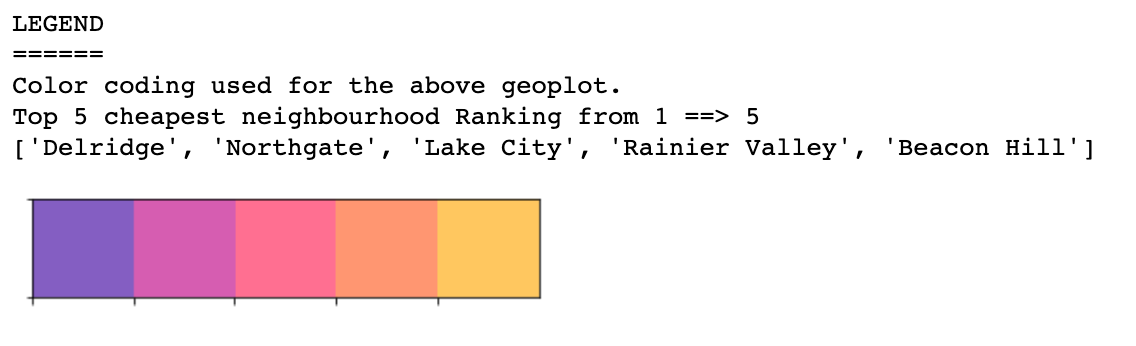
Top 5 Cheapest Neighbourhood in Seattle
  1. Delridge
  2. Northgate
  3. Lake City
  4. Rainier Valley
  5. Beacon Hill
Using geopandas to plot the neighbourhood on the graphs we get the below graphs.
Conclusions
In this project, I tried to analyse Seattle Airbnb data to answer 3 questions that can help users and business equally.
We saw a price trend in the property listing. The prices are the lowest in January till March and slowly increases until July - August which is peak pricing. Then it drops to average pricing by December. So we can safely say the most affordable time of year to book Seattle Airbnb is during January - March. And the costliest time of the year when the prices are the highest is during July - August.
The top 5 rated places, based on user reviews, in Seattle, are Central Area, West Seattle, Delridge, Ballard and Queen Anne (in the decreasing ranking order).
Top 5 Costliest Neighborhood (in the decreasing ranking order) in Seattle are Magnolia, Downtown, Queen Anne, Cascade and West Seattle.
Top 5 Cheapest Neighborhood (in the decreasing ranking order) in Seattle are Delridge, Northgate, Lake City, Rainier Valley and Beacon Hill.
Deducting from the above two points we can see, West Seattle and Queen Anne are two highly-rated places which are among the top 5 costliest neighbourhood in Seattle. Delridge is one of the highly-rated places which is among the top 5 cheapest neighbourhood in Seattle.
Disclaimer: Please note that the findings are observational and is particular to the given data set. In reality trends and rankings might be different.
To see more about this analysis, see the link to my Github available here.